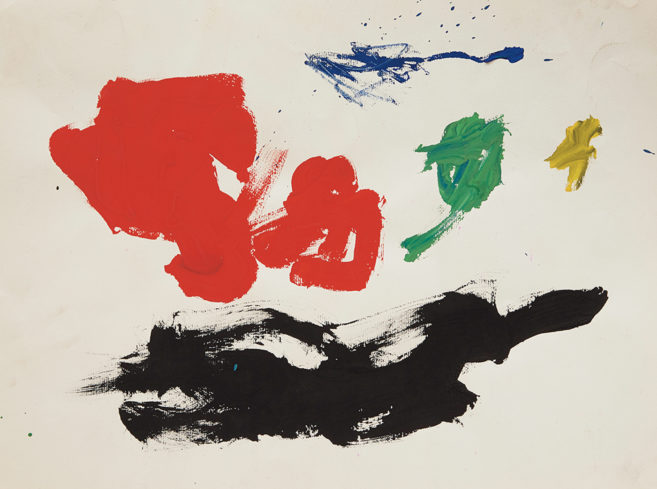
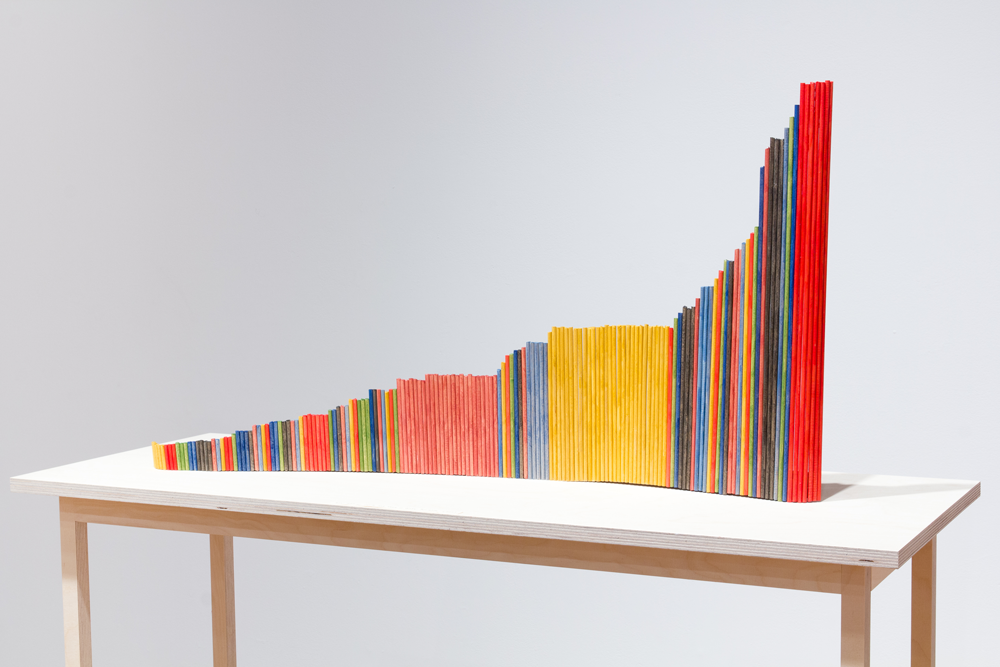
 Richard Ibghy and Marilou Lemmens, from the series Measures of Inequity, 2016.
The Canada Council for the Arts recently revamped its funding policies with an emphasis on diversity. Both press coverage and official program guidelines indicate that “commitment to reflecting—through artistic programming, organizational make-up and development of your publics—the diversity of your geographic community or region” are funding criteria that have new weight.
How is the diversity of geographic communities measured? On the most basic level, one would think that this includes taking stock of, for instance, upper management. How we, as a community at large (that is, the visual-art community), reflect the larger community at large is a big question.
Indeed, when a friend sent a message to me in early December 2016 asking if I knew any datasets on diversity in large art institutions in Canada, I drew a blank, and then, half-joking, concluded that it would just be easier to count.
The question continued to come back. We know there’s a severe lack of diversity in the art world (see this publication’s “Canada’s Galleries Fall Short: The Not-So Great White North” by Alison Cooley, Amy Luo and Caoimhe Morgan-Feir, whose information maps interestingly onto my own Waging Culture studies on the socio-economic status of visual artists in Canada). There is however, as per usual in the visual arts in Canada, a severe lack of hard data.
Some might consider this just another bean-counting exercise. I would agree that the purpose of quantitative analysis does often miss a large part of the story. On the other hand, qualitative analysis of the situation is not possible without grounding in commonly accessible, hard, quantitative data. It is in the quantitative that we get away from mere conjecture and obvious platitudes, and onto a terrain where underlying assumptions can be revealed and, hopefully, addressed.
Methodology
The first issue is the question of definitions: how are we selecting the population that we will examine? Should we include all galleries in Canada? All galleries whose budgets exceed $2 million? All public galleries?
The most logical method is to select galleries that receive(d) core funding from the Canada Council—that is, those galleries that have been deemed worthy of ongoing public support as determined by a robust peer-review process. Although the National Gallery of Canada receives its funding directly from the federal government, I added them in for good measure—were they not a direct federal agency, one would assume they would be receiving operating funds from the Canada Council. Focusing on galleries that received core funding results in a manageable number, easily assessed by using the Canada Council website (in particular, the “who got a grant” widget, with the proper filters applied).
This ends up with 80 galleries in total. I’ve categorized each gallery, based on the amount of operating-support funds they received from the Canada Council, into four quartiles—which are made by sorting a full set of data and then breaking it into four equal parts. The quarter of galleries that received the smallest grants are in the first quartile (Q1), while the quarter of galleries that received the largest grants are in the fourth quartile (Q4).
The galleries are also categorized by region: Atlantic (Nova Scotia, New Brunswick, Prince Edward Island and Newfoundland and Labrador); Quebec; Ontario; Prairie Provinces (Alberta, Manitoba and Saskatchewan); British Columbia and the North (the latter, in this case, being only the Yukon, as there are no galleries in this dataset that are in either Nunavut or the Northwest Territories).
At this point, I suppose I could have canvassed the galleries’ entire staff, but the focus here is on those with more control over the shape of the galleries’ programming. Security guards, for instance, might skew the results to appear more diverse. So, for each gallery, I compiled a list, circa 2015, of all full curators (as opposed to assistant or associate) and directors. I included a third category of director/curators, as there is a certain size of organization that either lacks the resources for both a curator and a director, or whose institutional mandate is such that the director is intimately tied to curating and not just, say, administrating and fundraising. All told, this list contains 184 people. Then, I classified them: visible minority/Indigenous/Caucasian and men/women. (A summary of the data, broken down primarily by job titles, is available.)
While I knew most of these people already, there were those with whom I was not familiar. To be as accurate, and efficient, as possible, I worked with a number of confidantes across the country to help in the classification. Some of my confidantes did not want to be identified, so I haven’t named any of them. To everyone who helped out: thank you immensely for both the information and for working out various conceptual issues. I would be remiss, however, not to point specifically to the work of Léuli Eshraghi, whose compilation of Indigenous curators and academics at institutions in Canada, New Zealand and Australia is both as exhaustive and as compelling an instance of “quantitative advocacy” as any I’ve come across.
Back to the analysis, though.
The categories I’ve used are broad and do not distinguish beyond the generic. This is one of the ongoing drawbacks of using quantitative analysis: some differences are elided, others highlighted. An exhaustive accounting of the subtleties of each individual, however, would not end up with a more complete picture, but rather 184 distinct, and unrelated, anecdotes. As for the question of gender, while it appears the data excludes non-binary identifications, this is not the intent. None in the dataset, as far as could be determined, identifies as gender non-conforming, two-spirited or other possibilities.
Finally, I started graphing.
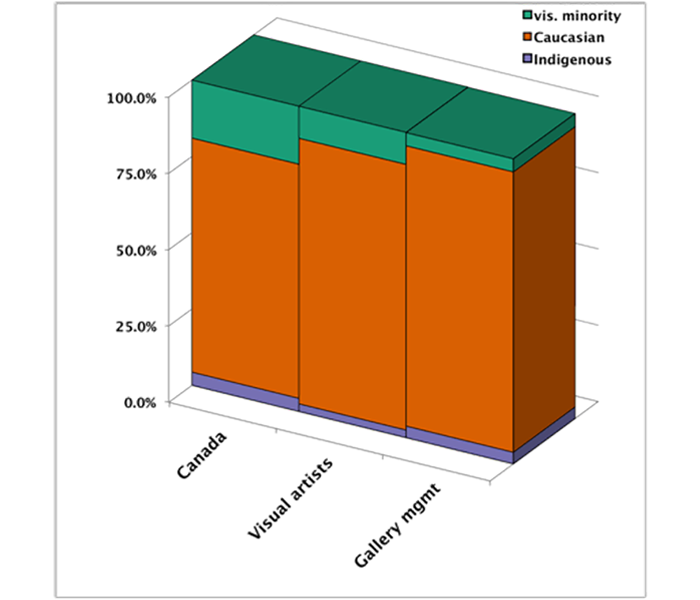
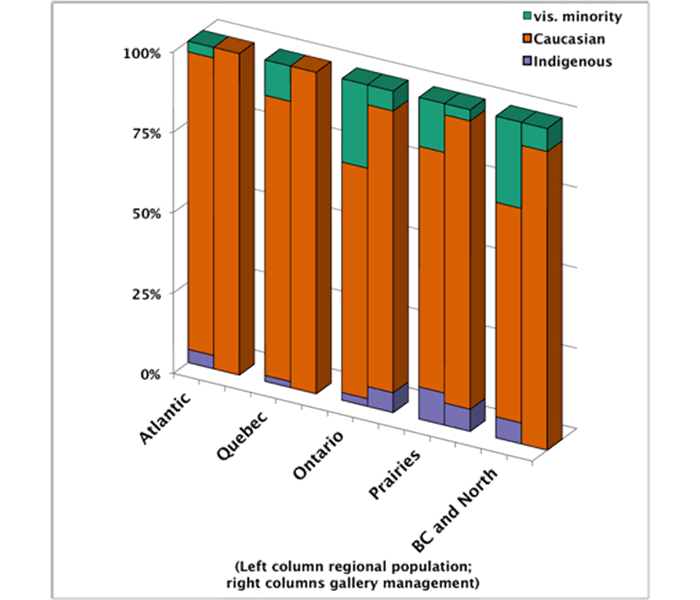
Figure 1: Comparative demographics by population
Key Finding: Gallery management is whiter than Canadian artists in particular, and the Canadian public in general
The entire pool of arts professionals in this survey consists of 184 persons, and of these, just shy of 92% are Caucasian, just less than 4% are Indigenous and just more than 4% are visible minorities. How does that compare with other populations? That depends on what your assumptions and frames of reference are. But however you look at it, it’s not great. One could compare these numbers to the visual-artist population—which, in 2012 (according to Waging Culture), consisted of 87% Caucasians, about 2.5% Indigenous and just more than 10% visible minorities. Alternately, one could compare these numbers to the general Canadian population which in 2011 (results from the 2016 census have yet to be released) consisted of 77% Caucasian, around 4.5% Indigenous and 19% visible minorities.
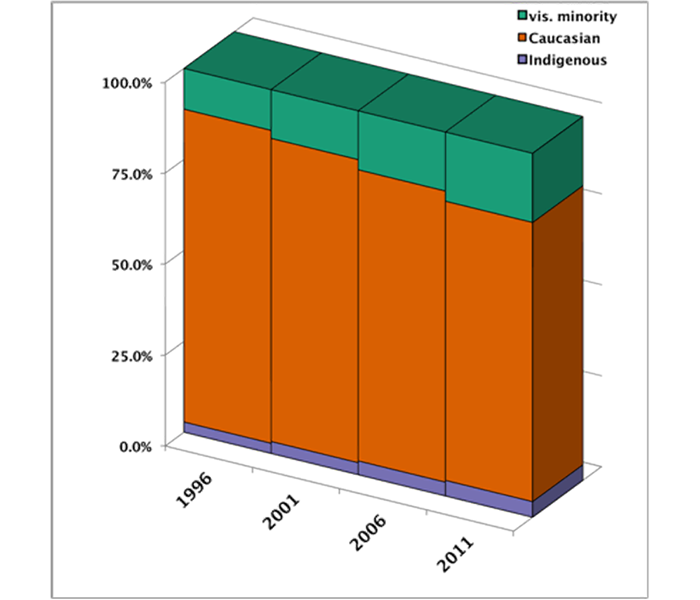
Figure 2: Demographics over past 20 years
Key Finding: Gallery-management diversity is lagging behind even 1996 general-population demographics
For context, looking at demographics from census data since 1996, we can see that visible-minority and Indigenous populations in Canada have been increasing over the last 20 years, but gallery-management diversity is lagging behind even 1996 numbers.
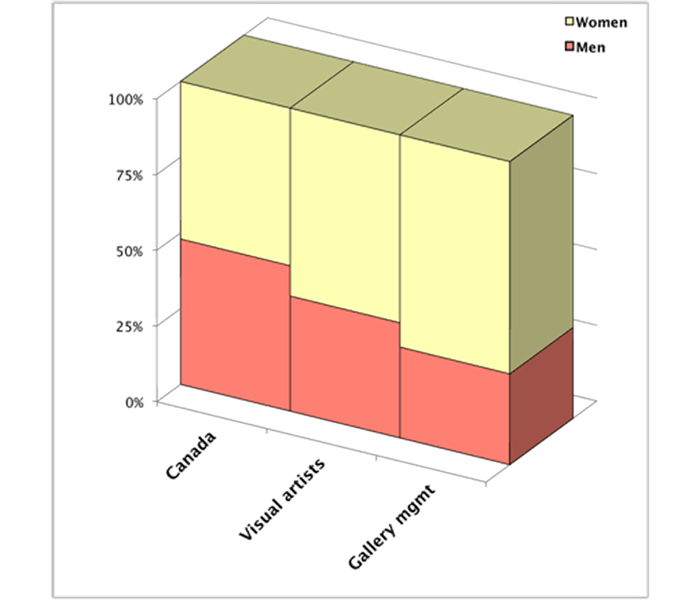
Figure 3: Gender by population
Key Finding: Women dominate Canada’s art field, but not its top echelons
As for gender, directors and curators are 70% women and 30% men. This compares to 62% versus 38% for visual artists, and an approximate 52% versus 48% for the general population.
For those looking at the percentage of women as a positive, don’t celebrate quite yet. It’s true that women dominate the field in sheer numbers, and the same holds true for professional visual artists, where 62% were women in 2012 (see Waging Culture). The current dataset does not have the same scope of detail as the Waging Culture study, but we can come to some of the same conclusions, and they are not great: namely, that there is an overall tendency for women to be less represented as one moves to higher income brackets. (See Figure 4, below.)
The quick conclusion: as a sector, we aren’t doing all that well in reflecting the population at large, on either ethnic or gender lines.
Some might say that this is too small a sample to draw conclusions from. But I am actually assessing all the galleries receiving core operating support from the Canada Council here, not just a small sample. These numbers are based on the entire population, and they say a lot. While I haven’t made a figure to reflect this finding, it is important to note, for instance, that within this population of decision-makers at publicly funded art galleries, there is not a single man who is part of a visible minority.
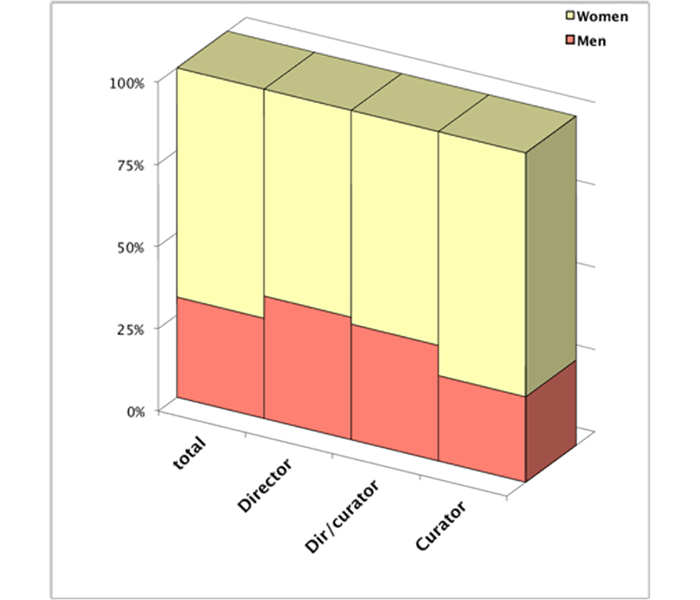
Figure 4: Gender by job title
Key Finding: The higher up we go, the lower the percentage of women employed
First, if we are to rank these positions in terms of amount of institutional power and salary levels—curator < director/curator < director—we see that the higher up we go, the lower the percentage of women employed. Even though at the level of director we can see that the field is still dominated by women, the more powerful the position, the less dominant women are.
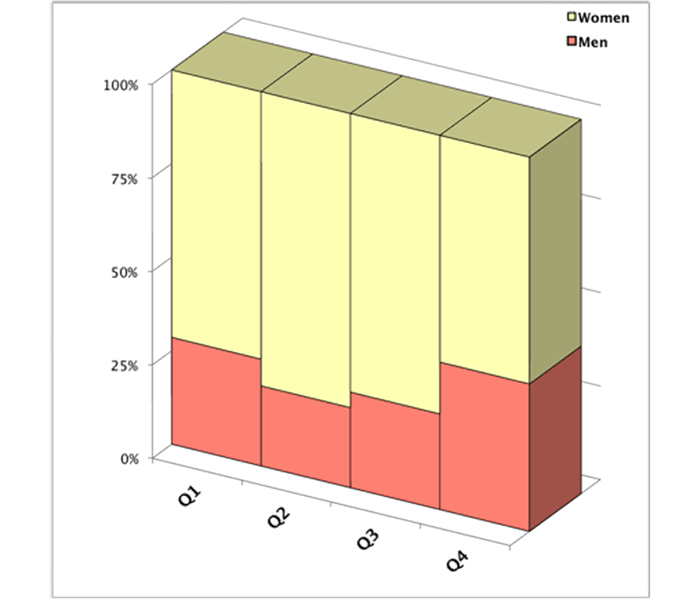
Figure 5: Gender by quartile
Key Finding: Canada Council–funded galleries employing women receive, on average, 20% less than those employing men
More damning is the graph that shows the gender split across the four quartiles of funding from the Canada Council. When we look at this breakdown, we find the highest percentage of women staff in Q2, in which galleries receive an average of $64,000 in Canada Council grant money. When we look at Q3 and Q4—where Canada Council grant awards increase to an average of $120,000 and $209,000, respectively—the percentage of women employees drops. Indeed, it could be said that Canada Council–funded galleries employing women receive, on average, 20% less than those employing men. While this doesn’t translate easily into a gender-based wage gap, it certainly is of the same order of downward pressure on resources available to galleries that employ women.
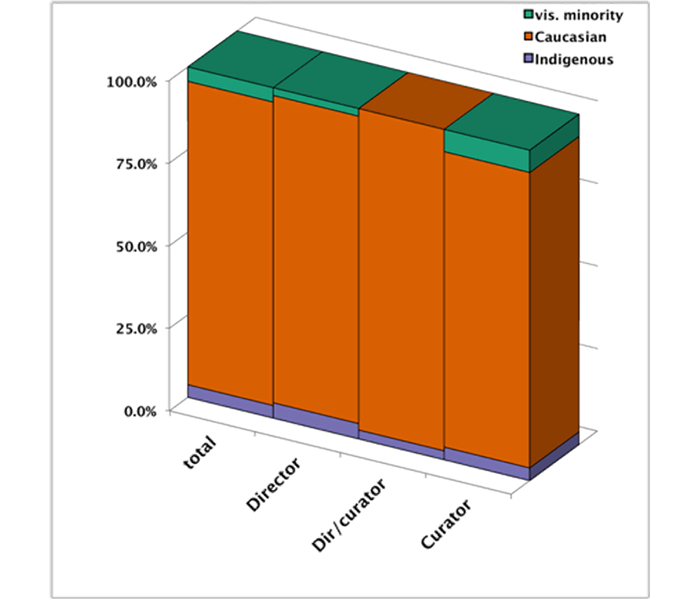
Figure 6: Demographics by job title
Key Finding: Visible-minority and Indigenous gallery administrative staff is severely underrepresented
Unlike gender, the main story of visible-minority and Indigenous gallery administrative staff is the severe underrepresentation as compared to the general population (similar to Waging Culture findings). Indeed, the representation is so low that any fine-grained analysis of other trends within the data, cross-tabulated with visible-minority status, must be taken with a certain amount of caution.
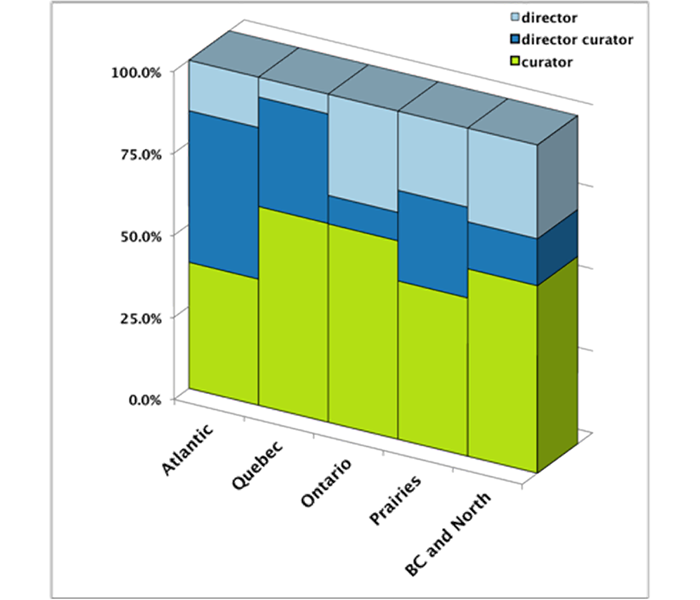
Figures 7 and 8: Job titles and demographics by region
Key Finding: Regional art-ecology particularities matter
The picture becomes clearer with a regional analysis against census data from 2011.
In putting together data for this piece, one of my confidantes from the Atlantic pointed out a factor that may ameliorate somewhat the direness of that region’s numbers. Director/curator positions at smaller regional centres can be quite attractive, but these positions tend to demand a long career track to acquire. In fact, many people who hold these positions are currently quite close to retirement, particularly in the Atlantic. In a small way, then, it might be more accurate to compare the staffing figures not to current demographics in Canada, but rather to previous years, as illustrated in Figure 2.
The visible-minority and Indigenous populations in Canada have been increasing over the last 20 years, but not enough to explain completely the population-to-sector discrepancies.
Neither does the argument, that will be made from several quarters, that programming is made more diverse by exhibitions that have been curated by visible-minority or Indigenous assistant curators or by independent curators. That is fine and good, but we are looking at institutional decision-makers. An independent curator may have a fantastic vision, but they don’t, for one, have job security.
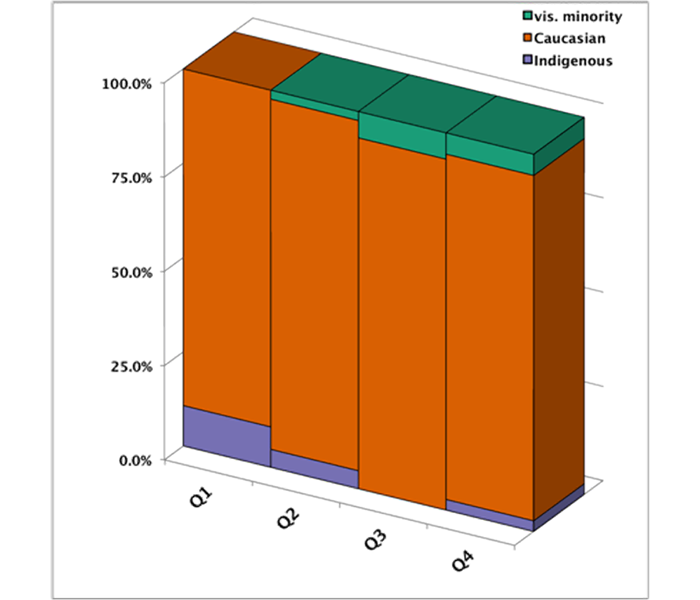
Figure 9: Demographics by quartiles
Key Finding: The less money a gallery receives, the more likely the director or curator is Indigenous
Moving along, despite the caveat of pulling correlations out which could be explained by under-representation alone, it is interesting to look at an apparent correlation between funding levels and distribution of this particular demographic marker. In general, the less money a gallery receives, the more likely that the director or curator is Indigenous.
Conversely, the more money a gallery receives, the more likely that the director or curator is a visible minority. As a proxy for a more fine-tuned indication of correlation: the average grant received for Caucasian staff is $127,000. For Indigenous curators and directors, that amount is $67,000. For visible-minority staff, that amount is $141,000. Obviously, there are underlying questions that a mere dataset cannot answer, but the low grant levels for Indigenous staff are particularly distressing.
As for the higher amount for visible minorities, one could look at this with a certain amount of charity and say that the Canada Council has recognized the strength of having representation of visible minorities on staff in decision-making positions and grants awarded are thus higher. Alternately, one could say that the presence of visible minorities correlates to higher-quality programming in general. The first assumption would be belied, however, in the reverse trend for galleries that have hired Indigenous curators and directors. The second possibility is probably true, and has an effect on the numbers, but there is also a more troubling third possibility: it is only in larger institutions with higher staffing levels that galleries’ boards feel comfortable hiring visible minorities.
In the end, it is the boardrooms of these institutions that must be held accountable. They set conditions of representation within the galleries’ programs through their hiring. It, perhaps, should come as no surprise that diversity in the boardrooms of Canada (a population somewhat equivalent to the pool of candidates for the boards of, at least, the larger galleries) is similarly unrepresentative of Canada at large. In 2016, for example, a mere 4.5% of board members at the 500 largest corporations in Canada were visible minorities, and a mere 0.6% were Indigenous.
Canadian galleries, back to you.
Michael Maranda is assistant curator at the Art Gallery of York University. An editor and former artist, he has a thing for numbers and a well-crafted chart.